US Digital Video Report & Facts: Views Jump 43% , Internet TV 388%
People in the United States were quite busy during the second quarter of 2014, as they watched no less than 38.2 billion videos in that timeframe. Compared to Q2 2013, this is a 43% increase, contributing towards the continuous growth of desire for online video content. This is not the only sector that enjoys growth – online TV has also increased by 388%. On a year-over-year basis, monthly unique views grew by 146% and the last six months seen a 85% increase, as well.
There’s also a downside: we rarely watch whole videos, especially on portable devices. According to the US Digital Video Benchmark Report from Adobe, people who watch videos on PCs or laptops are three times more likely to go through 75% or more of the clip, compared to mobile users.
Highlights and Facts from Adobe’s report for Q2 2014:
- The use of gaming consoles and OTT devices (smart TVs, consoles) to watch videos has increased by 194% throughout the last year.
- Tablets and smartphones are the medium in which 26% of online videos are watched.
- People who watch a quarter of a video on a PC or a laptop are three times more likely to get past the 75% mark of the video.
- People have started 26.6% of online videos on their mobile devices, a growth of 8% from 2013.
Massive growth regarding online video views
Video starts have increased during Q2 2014. The number in now at a record 38.2 billion starts, which is a 43% increase from Q2 2013. If we go back even further, we find out the total number of video starts grew by 47.3% from one year to another, this being a 9.4% acceleration over a quarter.
Impressive growth in viewing online TV content
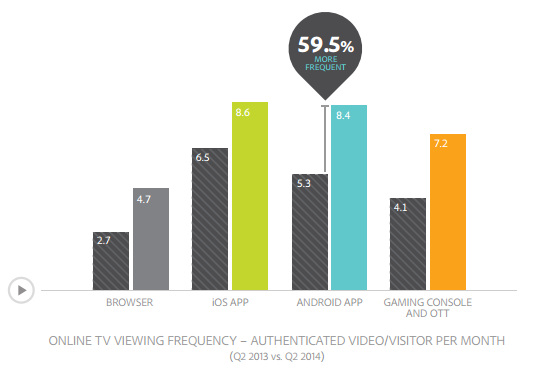
An all-time high of viewers who watch TV through OTT devices or through game consoles has been reached. Adobe shows that the increase has a value of 55% year-on-year. This big jump can be attributed to the World Cup, to the Winter Olympics and to March Madness.
Video game consoles and other OTT devices are slowly but surely becoming the favorite choice when it comes to streaming online TV content. The market share grew by 194% since 2013. On the other hand, viewing TV channels on a desktop went down by 41%.
Tablets vs Smartphones:online video facts
25% of viewers watch online video through mobile devices, which is a year-on-year increase of 57%. The smartphone is the preferred choice, which is more popular than tablets; phones witnessed a 59% YOY increase of market share.
Smartphones contribute to 13.6% of total video starts and tablets have another 13% of the total. iOS dominates the number of views, with more than half of them.
Brands need to consult with video specialists and make sure their content is compatible with mobile devices. Moreover, if they want to do effective video marketing, they should use mobile-friendly hosts for their video content.
26% more video ads served compared to 26%
Adobe confirms that 25.8% more ads are watched per video starts compared to Q2 2013, reaching a 2.08 ads-per-video value currently. Sports ads are leading here, considering the World Cup increased the number of video advertisement starts by 66%.
Of course, sports content has a tremendous potential when it comes to ad engagement, but there is the need of constant tracking with the proper software if brands want to find out which content might provide a better response from viewers.
Methodology employed by the Digital Index published by Adobe
The current report is based on information gathered between Q2 2013 and Q2 2014 and it makes use of 165 billion video starts in the online environment. US and Canadian based apps and websites were the ones measured, 253 being their number. You can access here the complete report and you can also check out a video overview published by Adobe at the top of the article.
Image Source: 2014 US Digital Video Benchmark Report from Adobe


